The Folyami Rating System
- An Elo-like system
- Remoteness weights
- Provisional factors
- Expected score and the gamma performance model
- Appendix: illustrative charts
- Acknowledgements
by Daniel Mlot — 2023-01-15
Source code for generating this document (on GitHub)
This document presents the design choices that shape the Folyami rating system. Though based on the well-known Elo rating system, Folyami incorporates several modifications which aim at making it suitable for racing competitions and, in particular, ZakStunts.
An implementation of Folyami can be found at https://github.com/duplode/elo-zs. While it currently lacks a polished interface, it is otherwise fully functional. Note that the description here corresponds to the default configuration of the elo-zs program. The implementation allows the various extra features of the Folyami system to be tuned, or even turned off to obtain a regular Elo system.
An Elo-like system
What makes Folyami an Elo-like system is how rating updates are done in it. In the Elo system, ratings are updated according to the results of matches, which always involve two players. The difference between the ratings of the players in a match reflects how likely a victory by the highest rated player is regarded to be. After a match, the players exchange rating points, with the loser transferring points to the winner. The formula for the change in points incorporates the difference of ratings before the match, so that the more surprising the result, the larger the change. The key formula which expresses this update procedure is:
\[R’_{X} = R_{X} + K(S_{X} - E_{X})\]
Where:
- \(R’_{X}\) is the updated rating for player X. (Whenever necessary, we will refer to player X’s opponent as player Y.)
- \(R_{X}\) is the player X rating before the match.
- \(K\), the modulation factor, sets how fast ratings vary with incoming results. It amounts to the maximum possible rating change in a match.
- \(S_{X}\) is the player A score in the match: 1 for a win, 0 for a loss, and 0.5 for a draw.
- \(E_{X}\) is the expected score for player A before the match. Ignoring draws, it corresponds to their probability of victory. The expected score grows with the difference in ratings between players X and Y. (We will consider how it is calculated in a moment.)
For instance, consider an Elo system using the formula above with \(K = 18\). Suppose that, before a given match, \(E_{X} = \frac{2}{3}\). That means X is deemed to have a winning probability of about 67%. If X confirms their favouritism and wins the match, they will get (and Y will lose) only 6 points (one third of \(K\)). However, if Y pulls off an upset, they will get (and X will lose) 12 points (two thirds of \(K\)).
Folyami uses the formula above to update ratings. The main differences with respect to Elo lie in how the expected score is calculated, and how the value of \(K\) is set. Before having a close look at those differences, we should mention how other key aspects of Elo translate to Folyami:
Folyami is a system focused on racing competitions, and a race is a many versus many match, rather than one versus one. This difference is bridged by regarding a race as a collection of one versus one matches. In effect, a race is handled as a single round-robin tournament, with a racer winning the matches against racers below them on the scoreboard, and losing the matches against racers above them.
The one versus one matches in a race are regarded as happening simultaneously, with the same pre-race ratings being used to calculate expected scores in all of them.
Draws are possible, as racers can obtain the exact same time result in a race. Specifically in ZakStunts, draws are uncommon but not vanishingly so, given that the lap time clock resolution is five centiseconds.
The base value of the modulation factor \(K\) is 18. (This value, though is modified by several additional correction factors, which will be described below.)
The initial rating of new competitors entering their first race is 1500.
Remoteness weights
The biggest difficulty in using an Elo-like system for ratings in a racing competition is that races are not actually collections of one versus one matches. Since the position of each player in the race scoreboard is determined by their time result, the outcomes of the one versus one matches used by Folyami are not independent from each other. On the one hand, that means there is plenty of redundant information, which makes the ratings more volatile than we would like them to be (for instance, an isolated bad result in which a racer ends up last in a race with twenty competitors amounts to losing nineteen matches). On the other hand, there is also valuable information in the one to one comparisons, so we would rather not throw it all away either (specially in a competition like ZakStunts, in which races usually only happen once a month).
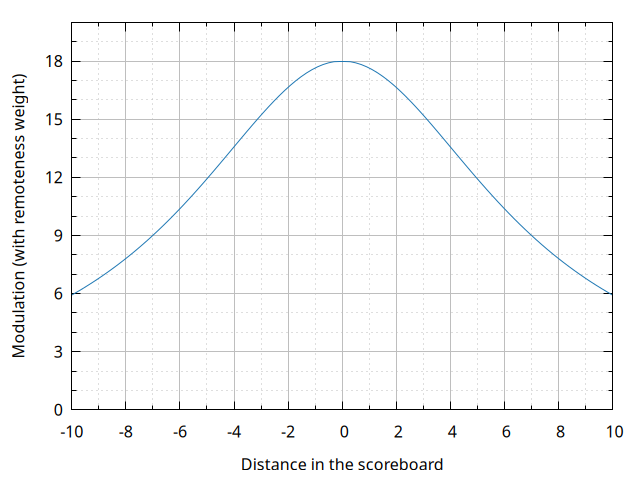
As a compromise between those two competing needs, Folyami incorporates all one versus one matches, but gives them different weights to keep the rating volatility from getting too high. The weight thus assigned to each match is called remoteness factor, as it depends on how far from each other the racers were in terms of race positions. The underlying premise is that the comparison between racers near to each other in the scoreboard, who were likely fighting directly for position during the race, tends to be more relevant than that between racers far apart from each other. The formula for the remoteness factor is:
\[q_{remote XY} = \frac{1}{\left(\frac{\pi}{22}\right)^2(P_{X}-P_{Y})^2+1}\]
Here, \(P_{X}\) and \(P_{Y}\) are the positions on the scoreboard: 1 for first place, 2 for second, and so forth. Draws are handled by assigning the average of what the positions would have been if a draw had not happened – for instance, if X and Y are drawn in fifth place, then \(P_{X} = P_{Y} = 5.5\).
The weighing curve is a witch of Agnesi, scaled so that in the limiting case of a scoreboard infinitely long in both directions the weights add up to 21. Below is a plot of the base modulation factor \(K = 18\) modified by the weights:
Provisional factors
One issue which any Elo-like system being ran over a long stretch of time has to deal with is effectively incorporating new players to the ranking. The initial ranking of a player is, at best, a guess, which might turn out to be unrealistic. That being so, it is desirable for new players to have their ratings updated more quickly as a consequence of their results, so that a reasonable rating is attained more quickly. Additionally, ideally we would like for the ratings of experienced players to be less influenced by matches with new players, whose ratings could be highly inaccurate.
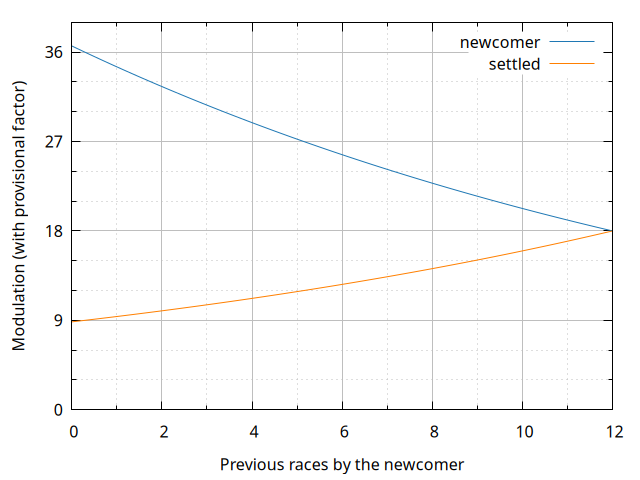
Folyami deals with this issue through a second kind of modifier applied to the modulation factor \(K\): the provisional factor. When a racer first joins the ranking, their \(K\) is multiplied by a factor for their first twelve races. The provisional factor decreases over those twelve races, converging to 1 along an exponential. The formula for the factor is:
\[q_{prov} = b^{12 - n_{prev}}\]
Where:
- \(b \approx 1.061\) is chosen so that the average factor over the window of twelve races is 1.5. It is the solution to the equation \(b\frac{b^{12}-1}{b-1} = 18\).
- \(n_{prev}\) is the number of races taken part before the current one, starting from zero for a new racer.
As for minimising the effect of matches against new racers, the Folyami approach is to, when a settled racer (that is, one which has already completed twelve races) faces a newcomer (that is, a racer in their initial twelve races), their \(K\) is divided by the provisional factor of their opponent. A single definition of the factor which accounts for all possibilities in a match between racers X and Y might be written down thusly:
\[q_{prov X} = \begin{cases} b^{12 - n_{prev X}} & \text{if } n_{prev X} < 12 \\ b^{n_{prev Y} - 12} & \text{if } n_{prev X} \ge 12 \text{ and } n_{prev Y} < 12 \\ 1 & \text{otherwise} \end{cases}\]
The graph below shows how the base \(K = 18\) gets modified by the provisional factor in a match involving a newcomer within the initial twelve races window and a settled racer. (Note that no remoteness weights are being applied in this graph.)
A few additional remarks:
If both racers in a match are yet to complete twelve races, each of them has their respective provisional factor applied.
The number of races considers the whole history of the racer in the competition. In particular, settled racers returning to the competition after a break do not receive a provisional factor unless they had less than twelve completed races, no matter how long the hiatus. (This aspect might be reconsidered in a future revision of the system, though accounting the uncertainty introduced by a hiatus in a way useful enough to justify the extra complexity would probably be tricky.)
Using different factors in matches between newcomers and settled racers means that Folyami doesn’t always conserve the overall sum of rating points. While such a conservation is sometimes touted as a fundamental property of Elo ratings, it only really applies to the ideal algorithm. The systems used in practice (for instance, by chess federations) often have \(K\) varying with experience or ratings, with similar effects on the overall sum. Besides, given that players can join, leave or rejoin the competition at any time, neither the global sum nor the average of ratings over the pool of active players can be expected to remain constant. All in all, exceptions to the conservation property are not a problem in practice, at least as long as systemic inflation or deflation of ratings are not caused by them.
Expected score and the gamma performance model
The Folyami system also differs from the Elo system in how expected scores are calculated. While this change has only a minor effect over the ratings themselves, it comes as part of a conceptual sharpening of the system which makes it easier to use for performance predictions and simulations. To motivate the change, we will begin by considering the Elo system. Let’s start by looking at the Elo expected score formula:
\[E_{Elo X} = \frac{1}{e^{-\alpha(R_{X} - R_{Y})} + 1}\]
Where:
- \(E_{Elo X}\) is the Elo expected score for player X in a match against player Y.
- \(R_{X}\) and \(R_{Y}\) are the ratings of the players X and Y.
- \(\alpha\) is a scaling constant, typically set to \(\frac{\ln 10}{400} \approx 0.005756\), so that a rating difference of 400 amounts to an expected score ten times larger than that of the opponent.
The expected score tends towards 1 as the rating difference increases towards infinity (and tends towards 0 as it decreases towards minus infinity), along a logistic curve.
Given that Elo match scores range from 0 to 1, the expected score can, as long as we disregard the possibility of draws, be interpreted as the victory probability for a player. Further still, the expected score formula can be derived from a performance model for the players with the following features:
Player performance is represented by a continuous variable whose minimum value, zero, corresponds to perfect performance – higher values correspond to mistakes and deviations from the ideal result.
Performances follow an exponential probability distribution.
The rating of a player is (proportional to) the logarithm of the rate parameter of said exponential distribution. A higher rating therefore means a more sharply decaying exponential PDF, and therefore an expected performance closer to zero, the ideal.
Some traits of the exponential performance model described above fit racing competitions very well. The performance variable can be interpreted in terms of lap or race times, with zero corresponding, for instance, to an ideal lap, and higher values to deviations from it. Linking a rating system to a performance model opens up interesting possibilities, such as using ratings to parameterise a simulator of race results.
The exponential model, however, has an important weakness when applied to races and simulations of them. Since even in a single race lap offers innumerable occasions for mistakes, a probability density function whose highest value is at zero, like the exponential, is not realistic. A distribution with zero density at zero, thus representing the perfect lap as an unattainable ideal, would be much preferable. Auspiciously, there is a simple way of fixing this problem: replace the exponential distribution with one of its generalisations, the gamma distribution, which has the following useful characteristics:
The gamma rate parameter, which is analogous to the rate parameter of the exponential distribution, can still be understood in terms of expected performance and converted to ratings.
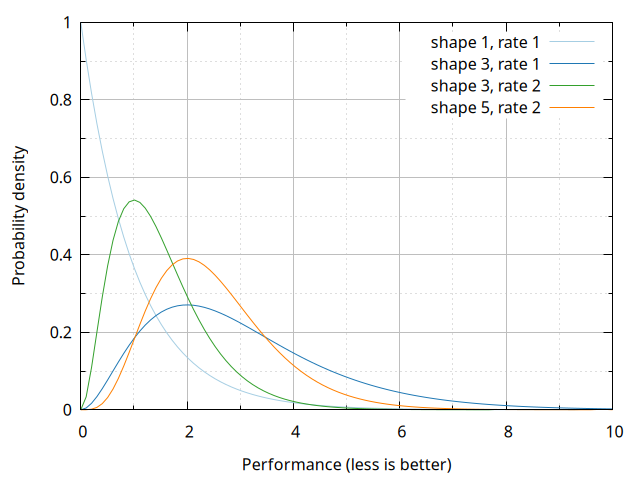
The gamma density is zero at zero for values of the shape parameter above 1 (with shape 1, it reduces to the exponential). The drop towards zero is superlinear for shape above 2, and increasingly so for higher shapes. In a simple interpretation of the model, a growing gamma shape can be associated with increasing track length and difficulty.
Given a match between two racers whose performances follow gamma distributions with the same integer shape parameter, there is a closed formula for the winning probabilities of the racers. Moreover, the formula has enough similarities to the Elo expected score formula for the intuition from one system to remain relevant in the other.
The graph below shows a handful of gamma probability densities, to give a sense of what the curves look like. The shape 1 example amounts to an exponential, the two shape 3 examples demonstrate changes in rate (with a higher rate corresponding to a higher rating), and the shape 5 illustrates the difference a shape increase makes:
Choosing the gamma shape with simulation realism as the main goal is, for the time being, a matter to be settled empirically. While experiments suggest 7 can be a plausible shape for single laps in NoRH Stunts, the adequacy of a value is heavily dependent on track, car and competition rules. The Folyami system uses a shape of 3, which appears to make for a simple yet minimally reasonable model for the ratings.
The Folyami victory probability/expected score formula, which therefore follows from a shape 3 gamma performance model, is:
\[E_{X} = 6W_{X}^5 - 15W_{X}^4 + 10W_{X}^3\]
Where:
\[W_{X} = \frac{1}{e^{-c\alpha(R_{X} - R_{Y})} + 1}\]
In these formulas:
- \(E_{X}\) is a polynomial of degree 5 in \(W_{X}\). In general, given a chosen gamma shape \(g\) for the model, \(E_{X}\) will be a polynomial of degree \(2g-1\) in \(W_{X}\).
- \(W_{X}\) is essentially the same as the Elo expected score. The only difference is an additional scaling factor, \(c\), whose introduction is a matter of presentation and not imposed by the model.
- \(c \approx 0.5188\) is chosen so that \(E_{X}\) is as close as possible to the Elo expected score. The point of such an adjustment is keeping Elo and Folyami ratings broadly comparable given a common choice of \(K\). Gamma shapes other than 3 would require a different value of \(c\) to play this role.
- Given \(\alpha = \frac{\ln 10}{400}\), we have \(c\alpha \approx 0.002986\).
The graph below shows the Elo and Folyami expected scores, as well as the bare shape 3 gamma victory probability without the adjustment by \(c\).
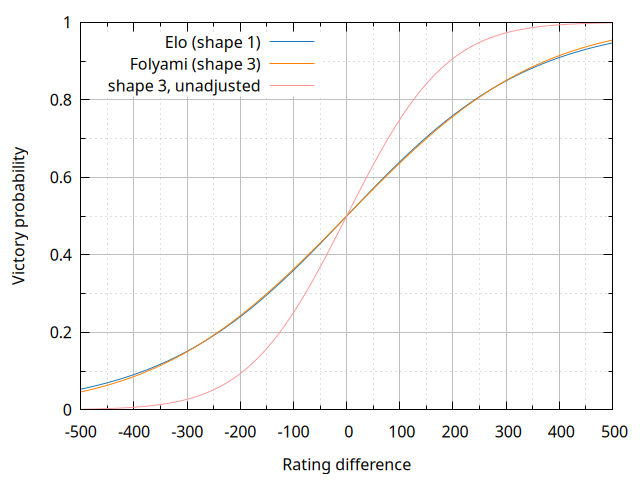
As the graph shows, the Elo and Folyami victory probabilities are similar to each other, with the absolute difference between them never exceeding 0.01. While using the Elo expected scores would have been defensible in face of this fact, the choice was made to trade this operational simplification for the clarity of not needing approximations to convert between ratings and performance models. In particular, the shape 3 gamma density associated with a rating can be given as:
\[d_{X}(z) = \frac{\beta_{X}^3}{2} z^2 e^{-\beta_{X} z}\]
Where \(z\) is the performance variable (in arbitrary units), and the rate parameter \(\beta_{X}\) is:
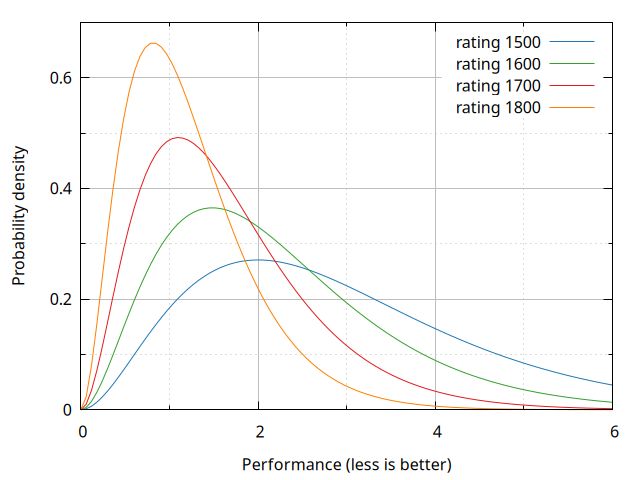
\[\beta_{X} = e^{c\alpha(R_{X} - 1500)}\]
(The subtraction of 1500 from the rating is cosmetic, performed so that the initial rating of 1500 corresponds to a rate parameter of 1.)
To wrap up this section, below are plots of a few gamma densities for specific rating values:
Appendix: illustrative charts
Points gained after a win
The table below displays several examples of points gained after a match win given different combinations of rating difference (rows) and remoteness/scoreboard distance (columns). No provisional factors are applied. Values are rounded to one decimal place.
| ↓ΔR \ ΔP→ | 1 | 3 | 6 | 10 | 15 |
|---|---|---|---|---|---|
| -500 | 16.8 | 14.5 | 9.9 | 5.7 | 3.1 |
| -300 | 15.0 | 12.9 | 8.8 | 5.0 | 2.7 |
| -200 | 13.4 | 11.5 | 7.9 | 4.5 | 2.4 |
| -100 | 11.2 | 9.7 | 6.6 | 3.8 | 2.1 |
| -50 | 10.0 | 8.7 | 5.9 | 3.4 | 1.8 |
| -30 | 9.6 | 8.2 | 5.6 | 3.2 | 1.7 |
| -10 | 9.1 | 7.8 | 5.3 | 3.0 | 1.7 |
| 0 | 8.8 | 7.6 | 5.2 | 3.0 | 1.6 |
| 10 | 8.6 | 7.4 | 5.0 | 2.9 | 1.6 |
| 30 | 8.1 | 7.0 | 4.8 | 2.7 | 1.5 |
| 50 | 7.6 | 6.5 | 4.7 | 2.5 | 1.4 |
| 100 | 6.4 | 5.5 | 3.8 | 2.2 | 1.2 |
| 200 | 4.3 | 3.7 | 2.5 | 1.4 | 0.8 |
| 300 | 2.6 | 2.3 | 1.6 | 0.9 | 0.5 |
| 500 | 0.8 | 0.7 | 0.5 | 0.3 | 0.1 |
Victory probabilities
The following table shows examples of victory probabilities in the absence of draws given different rating advantages. The percentages are rounded to one decimal place.
| ΔR | Victory % |
|---|---|
| 0 | 50.0 |
| 50 | 57.0 |
| 100 | 63.7 |
| 150 | 70.0 |
| 200 | 75.7 |
| 250 | 80.7 |
| 300 | 85.0 |
| 350 | 88.5 |
| 400 | 91.4 |
| 450 | 93.7 |
| 500 | 95.4 |
| 550 | 96.7 |
| 600 | 97.7 |
| 650 | 98.4 |
| 700 | 98.9 |
| 750 | 99.2 |
| 800 | 99.5 |
Acknowledgements
The Folyami system was inspired by the earlier efforts in creating rankings for the Stunts community, especially by Mark L. Rivers’ Stunts World Ranking.
Several of the design decisions in developing Folyami, especially those to do with the modifiers to the modulation factor, were informed by Glickman, Mark E., A Comprehensive Guide to Chess Ratings (1995).
